- This markets lagging sectors are $XLU, $XLP, and $XLV. These have held $SPY back from performing at the same pace as the DJIA and small caps.
- $XLF $IWM and $DIA have lead this run up. $SPY has benefitted from financials and big cap strength.
- Bond yields are rising as bond prices fall which has been bullish for stocks.
- The U.S. Dollar has been very strong which benefits companies that have their primary sales in the U.S. as their sales generate more buying power in other countries after the currency conversion.
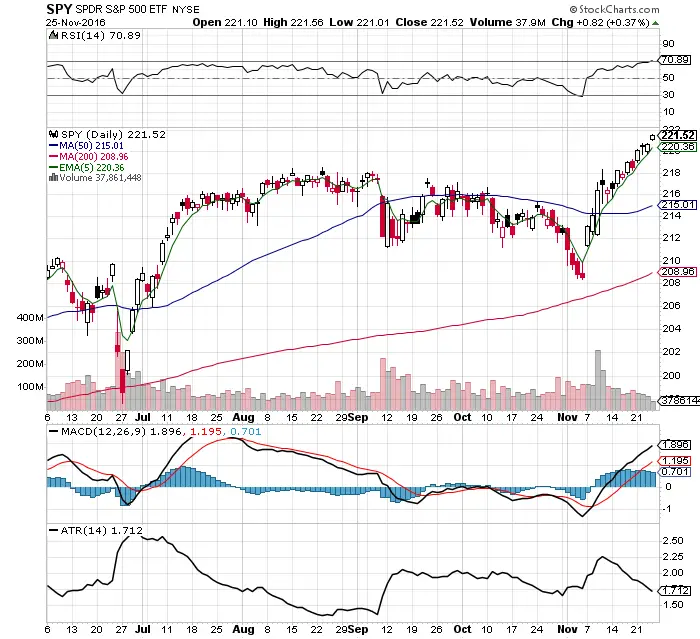
- The 5 day ema is now the short term support which only happens in the strongest uptrends.
- Volatility continues to decline day after day. This is bullish.
- MACD remains under a bullish cross.
- 70.89 RSI is overbought for the $SPY chart. The chart will likely form a new price base at this level before it goes higher.
- The market is at all time highs. It doesn’t get more bullish than that.
- This market continues to punish short sellers daily and rewards investors and buy and hold investors. Every dip is bought quickly as people trapped out of the market are eager to get in. I would love to buy a $SPY pullback around the $118.50 breakout level.
I am still long $TQQQ here and are looking to buy any pullbacks.
