Skip to content
 Chart Courtesy of StockCharts.com
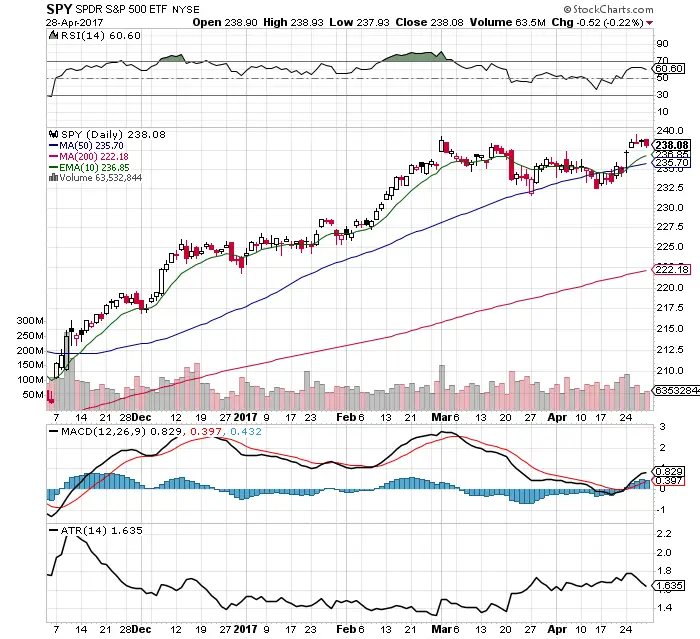
- $SPY remains in a long term uptrend above all moving averages.
- $SPY has been in a trading range since March with $240 resistance and $231 support.
- The MACD contains to maintain a bullish crossover.
- Volatility declined last week as measured by the ATR.
- Resistance was tested on decreasing volume last week.
- 60.60 RSI is not overbought and there is room to go higher.
- So many people are calling for a crash when this market can’t even get a good pullback since November.
- VIX continues to stay extremely low at 10.82. Put options are very cheap here.
- The geopolitical risk of North Korea is having little to no impact on the chart, which is bullish.
- Every signal on this chart is currently bullish. Buying small dips to the 50 RSI is what is currently working.

