Skip to content
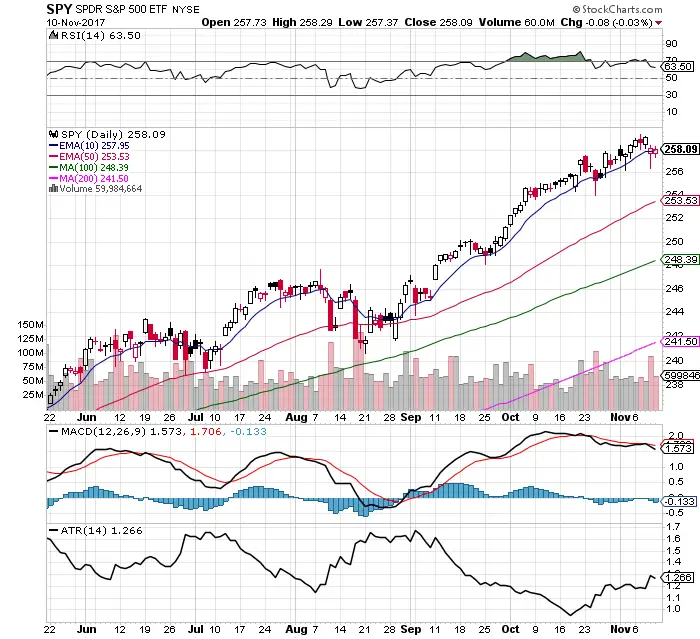
 Chart Courtesy of StockCharts.com
- SPY remains bullish near all time highs and above all key moving averages.
- The 10 day EMA has stopped being intra-day support leading to more of a range bound market than one in a sharp up trend day after day.
- Opening low and down and finishing higher is bullish. During downtrends the market generally opens high and ends lower.
- Last week down days in price were on higher volume than up days in price. Showing some distribution.
- SPY MACD remains under a bearish cross under as the market starts to go sideways.
- The price trading range continued to expand last week giving day traders more room to work intra-day.
- RSI remains bullish at 63.50 with room to go higher.
- VIX started making some higher highs and higher lows last week and ending at 11.29.
- The leading stocks in the $SPY ETF are all in strong momentum up trends: $AMZN, $AAPL, $MSFT and $GOOGL.
- Many signals are currently pointing to an expanding trading range and a potential short term pullback next week.

