Skip to content
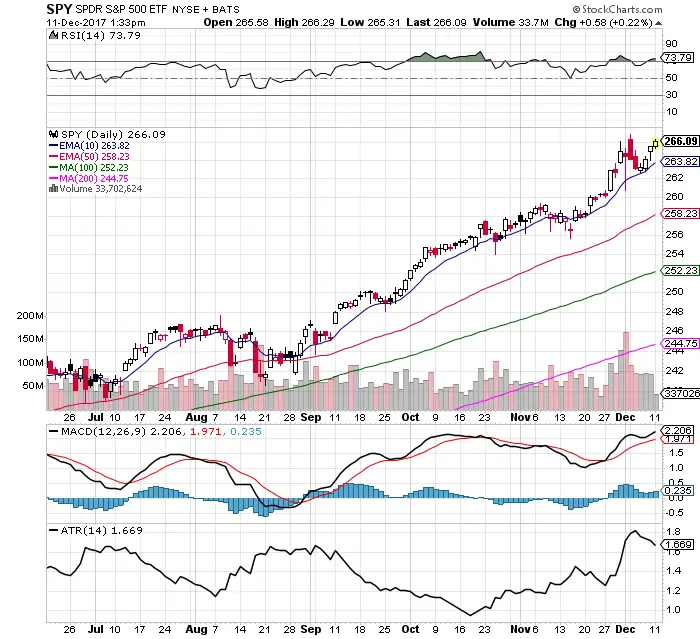
 Chart Courtesy of StockCharts.com
- $SPY is still bullish over all moving averages.
- $SPY is within striking distance of all time highs.
- The 10 day EMA has acted as end of day support since November 16th.
- $SPY has gone parabolic with upward momentum carrying price over the 70 RSI to 73.79.
- Every dip in price continues to be bought.
- The average trading range has declined over the past week.
- Price action remains under a bullish MACD crossover.
- Price has been going up on good volume over the past week.
- $VIX has fallen back to 9.51 showing a lack of fear in a big pullback here and cheap put options.
- Sectors still have room to rotate and take the index higher with few oversold market sectors.

