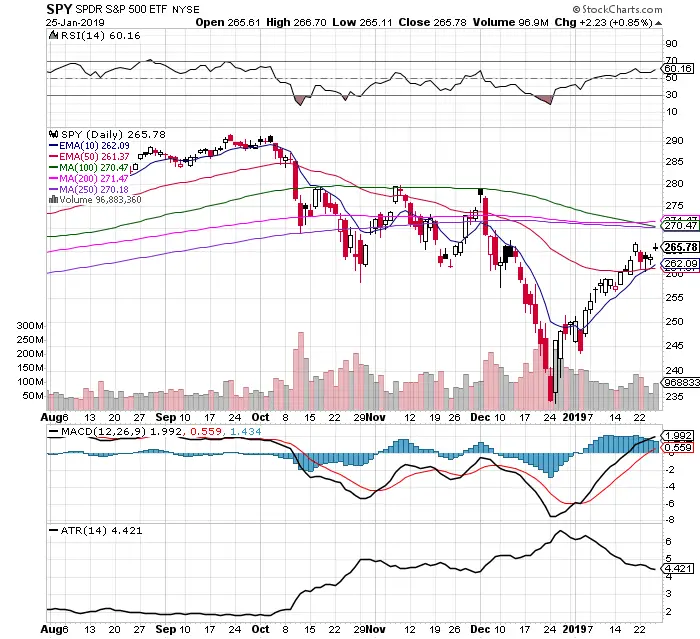
Chart Courtesy by StockCharts.com
- The overall sentiment on social media seems to be bearish and this rally is not believed to be real.
- $SPY is under the 10 day EMA / 50 day EMA bullish crossover signal.
- The volume during the up days last week were on increasing volume over last week.
- The 60.16 RSI shows momentum and has room to run farther before becoming overbought.
- The MACD remains under a bullish crossover.
- The trading range continues to decline to a 4.42 ATR.
- $VIX has been declining since December 26th and the last support for $VIX is the 200 day SMA.
- The 100 day, 200 day, and 250 day moving averages are starting to converge at $271 showing the nature of the past year’s lack of a trend going either way.
- A break above all key long term moving averages would signal the potential of a new uptrend.
- A deal being reached with a China trade deal could trigger a rally. This is headline risk for bears.
These are bullish signals on the $SPY chart, that is why I am bullish here and have long positions, my stop losses will have to prove me wrong. The more trend signals I get the more bullish I will get.
