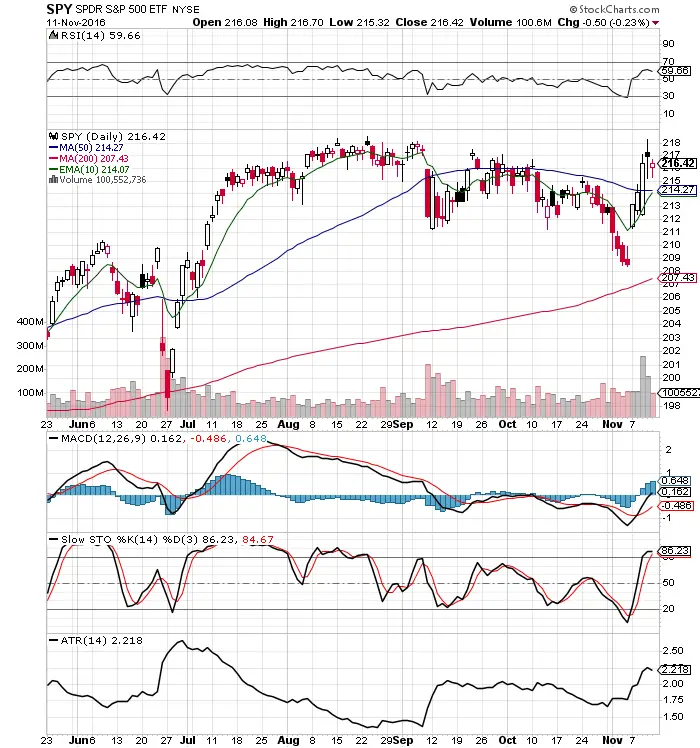
- The stock market went into panic coming into the uncertainty of the election as Trump odds of winning rose with the FBI looking back into Clinton e-mails.
- The downtrend immediately reversed as the FBI dropped the Clinton investigation at the $SPX 200 day sma.
- The market rallied into the election sure that Clinton would win and the status quo would be preserved.
- Overnight during the election the DJIA futures dropped 800 points as Trump lead the electoral college. This is not seen on the equity chart as the dip I was looking for only happened in the futures contract market.
Historic week for markets. Dow futures did this during the Election night: via @StockTwits https://t.co/eLePgxVpiC pic.twitter.com/OMrUygKnL2
— Steve Burns (@SJosephBurns) November 12, 2016
5. The next morning the market rallied back dramatically by the time the equity market opened and exploded higher.
6. The Stock Market loves Donald Trumps win so far.
7. Big caps, small caps, biotech, financials, and other sectors are exploding on the potential of a Trump presidency. $DIA $IWM $IBB $XLF
8. Tech and FANG have been laggards during this explosive rally.
9. Bond yields have risen as bond prices have dropped.
*BN: TRUMP: THEY HAVE TRIED TO STEEPEN THE CURVE FOR YEARS AND I DID IT IN TWELVE HOURS
— David Schawel (@DavidSchawel) November 9, 2016
10. The market is bullish again and the best odds are on buying any dips.