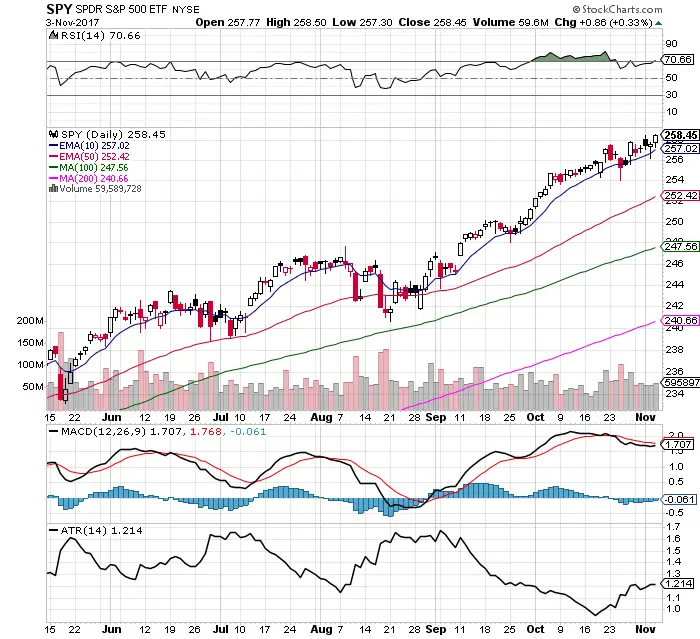
- The bullish signal of new all time highs continue.
- Price is bullishly over all moving averages.
- The 10 day EMA has been a key short term support level.
- The RSI at 70.66 shows the momentum to trend through overbought price levels. The RSI over 70 has been a momentum signal since November of 2016 in one of the most overbought markets in history.
- $VIX is near an all time historical low in volatility at 9.14. Creating very cheap put options on $SPY as fear is very low at these price levels.
- The ATR continues to increase giving traders more of an intra-day trading range.
- The MACD is under a bearish cross showing signs of a market losing momentum.
- Volume trended lower last week as prices pulled back and then went higher. Volume remains healthy.
- $XLK Tech sector has been the leader for $SPY going to higher prices with $FB $AMZN $GOOGL, and $AAPL leading the market higher.
- The winning strategies in this market have not changed, buy the quick dips or buy and hold long and follow the trend.
I remain long $QLD and $UWM here.
