A candlestick chart is a type of visual representation of price action used in technical trading to show past and current price action in specified timeframes.
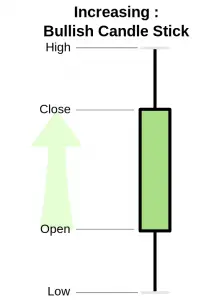
Most candlestick charts will reflect a higher close than the open as represented by either a green or white candle with the opening price as the bottom of the candle and the closing price as the high of the candle.These are bullish candlesticks.

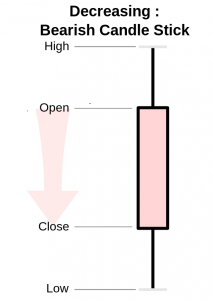
Also the majority of candlestick charts reflect a lower close than the open are represented by either a red or black candle with the opening price as the top of the candle body and the closing price as the low of the candle body.

Price action that happens outside the opening and closing prices of the timeframe are represented by the wicks or shadows above the body of each candle. Upper wicks represent price action that occured above the open and the closing prices and the lower wicks represent price action that occurred below the opening and closing prices.
Candlesticks are one type of chart that can be used in technical analysis to look for repeating patterns and in correlation with other technical indicators and signals.
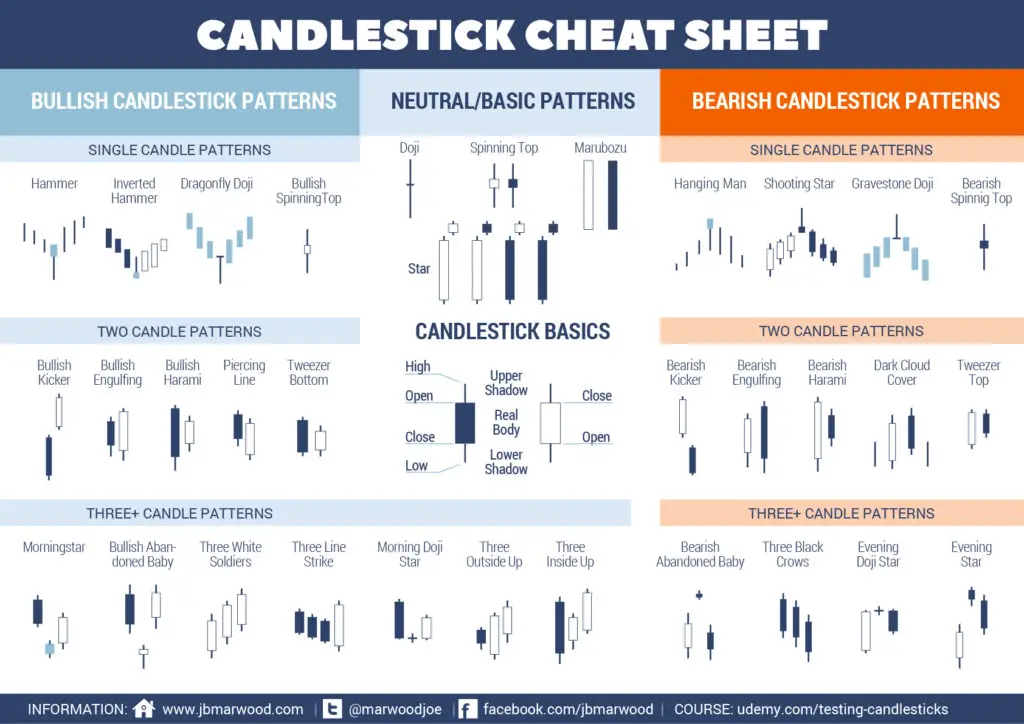
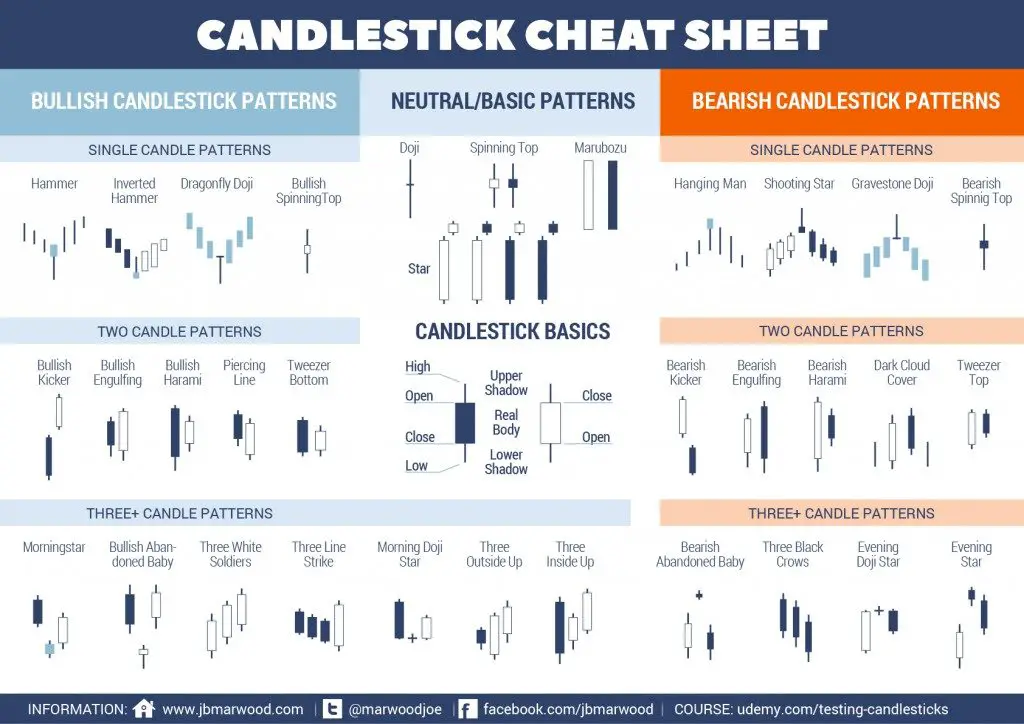
Here is a quick guide to different types of candlesticks and their meaning showing whether they are bullish, bearish, or neutral. You must also take into consideration the context of where these patterns form on a chart and their confluence with other technical indicators.

Candlesticks are combined in many ways to try to read the behavior of traders and investors in buying and selling to create good risk/reward setups for trading.
Here are links to other types of candlestick patterns and their full definitions:
Bullish Engulfing Candlestick Signal https://www.newtraderu.com/2020/07/05/bullish-engulfing-candlestick-signal/
Inside Bar Trading Strategy https://www.newtraderu.com/2020/06/30/inside-bar-trading-strategy/
Marubozu Candlestick Pattern https://www.newtraderu.com/2020/06/26/marubozu-candlestick-pattern/
Hammer Candlestick Pattern Explained https://www.newtraderu.com/2020/06/08/hammer-candlestick-pattern-explained/
What is a Hanging Man Candlestick? https://www.newtraderu.com/2020/06/05/what-is-a-hanging-man-candlestick/
3 White Soldiers Candlestick Chart Pattern https://www.newtraderu.com/2020/05/31/3-white-soldiers-candlestick-chart/
What is a Doji Candlestick? https://www.newtraderu.com/2020/01/06/what-is-a-doji-candlestick/
What is a Shooting Star Candle? https://www.newtraderu.com/2019/12/31/what-is-a-shooting-star-candle/
