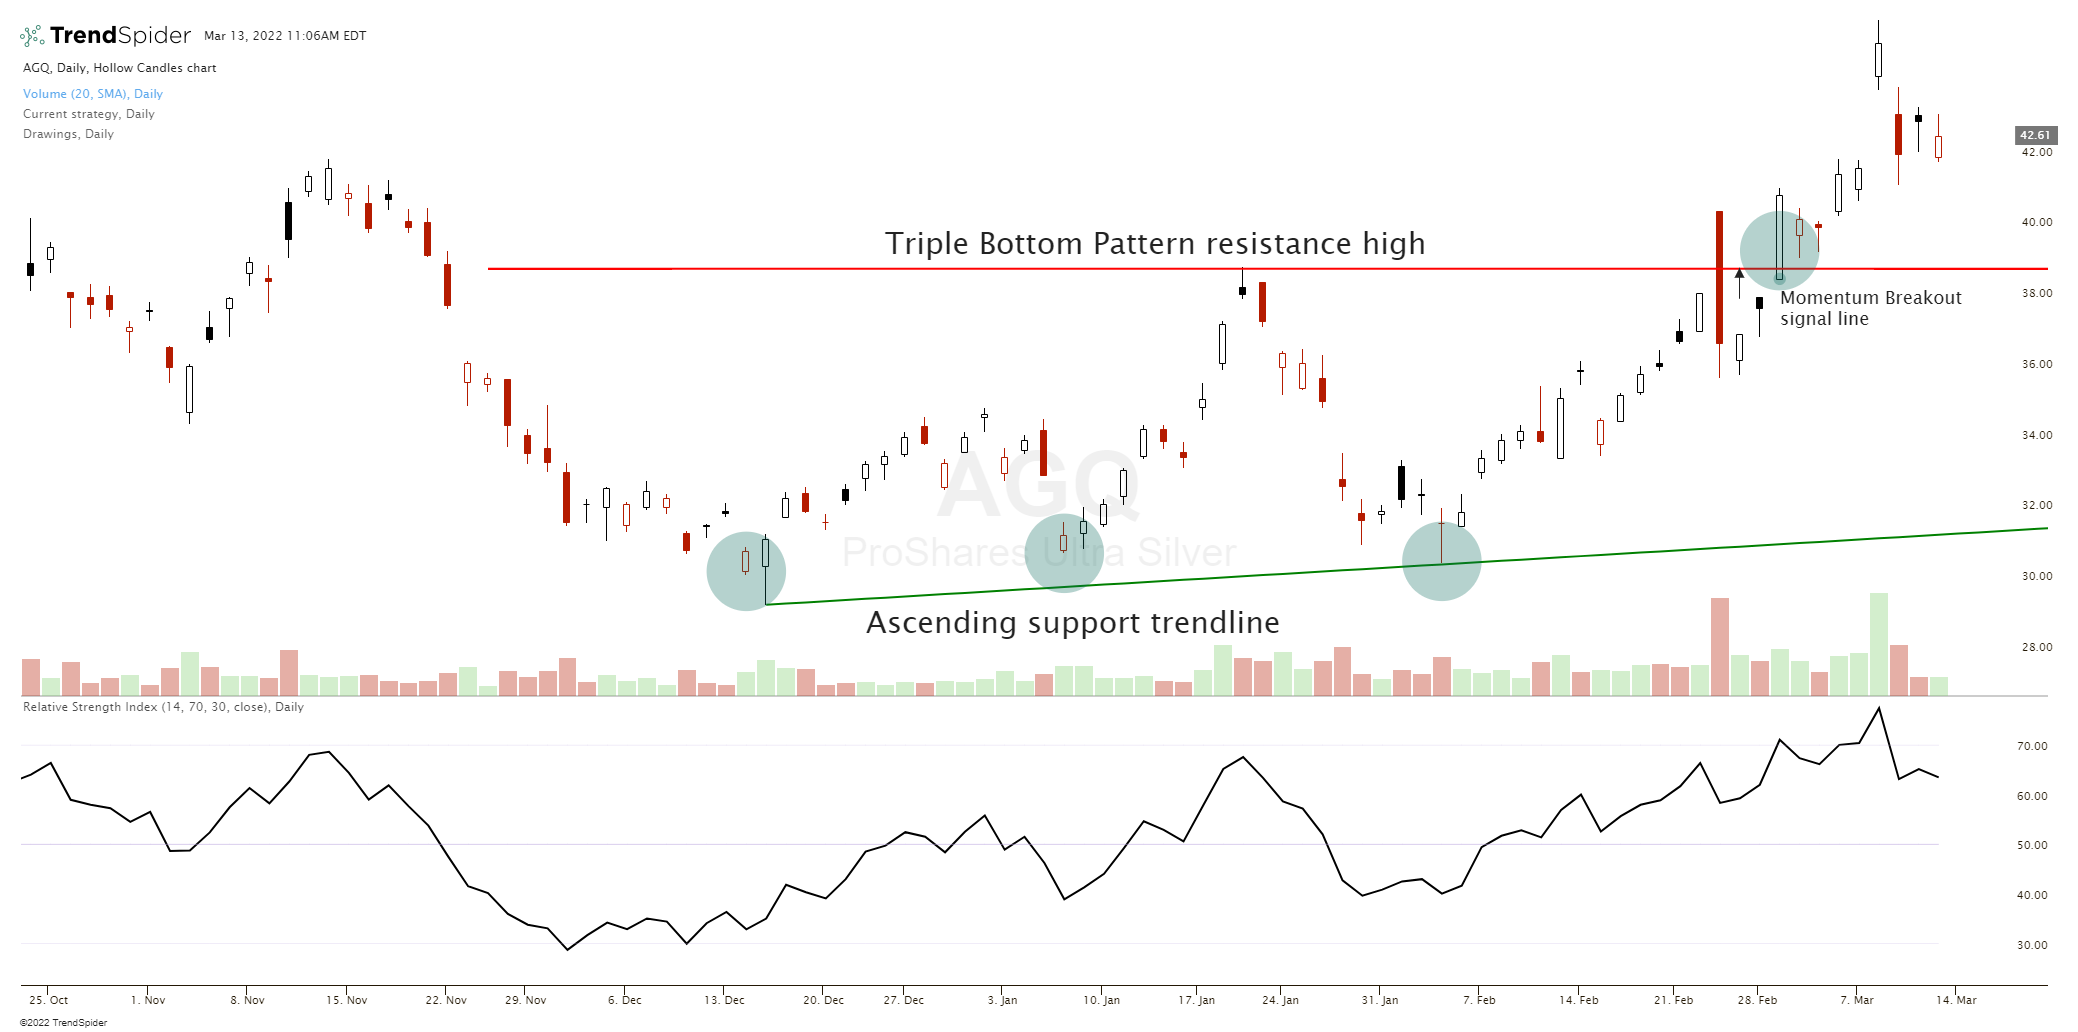
In technical analysis the triple bottom pattern can be a possible signal for a reversal higher in price. This pattern is formed when price action finds support inside a price zone three consecutive and separate times. This type of price behavior can give clues that there are no sellers at lower prices below that support zone to cause a breakdown and a trend continuation to the downside.
This pattern shows a high probability that a downtrend in price has ended and that it could reverse back higher soon. A new breakdown to lower prices and falling below the third support valley is a new bearish momentum signal if it occurs and changes the chart sentiment back to bearish nullifying the pattern.
A triple bottom chart pattern can happen on any time frame, but is only considered valid if it happens after a downtrend in price.
A triple bottom is created when price action forms three valleys very close to the same price area. These three valleys can be connected by a lower horizontal trend line below them and be considered support. Traders can also see swings higher in price between all three valleys that happen. The triple bottom is confirmed if the third rally after the third valley overtakes the previous swing high. This breakout above the swing high is considered the momentum buy signal.
The triple bottom price valleys are similar in technical dynamics to the inverted head and shoulders chart pattern; the difference is that instead of the head and shoulders all three valleys are closer to equal in magnitude. The double bottom pattern is also similar except the triple bottom has one more equal bottom. These three are all types of reversal patterns and can be bullish in the short term.
Many technical analysts will use the failure of a breakdown of the third price valley to signal long entries. If a long position is taken at the third price valley a popular stop loss is set if the price breaks and trends below that price support level.
The opposite of a triple bottom is a triple top which is an inverse signal that a chart has likely made a top.


