 Bullish price action trading creates chart patterns that show uptrends in a market through the buying pressure by traders and investors creating higher highs and higher lows and breakouts to the upside. A bullish chart pattern is a visual record of the votes by bulls that increase price levels over a period of time.
There are different types of chart patterns that reflect different types of overall sentiment. Continuation chart patterns confirm a trend is going to continue in the same direction with the current overall trend staying in place. There are also reversal patterns that signal a trend is likely to reverse. Bearish chart patterns show lower highs and lower lows and breakouts to the downside under support. There are bullish, bearish, reversal and continuation chart patterns, below is an overview of bullish patterns to look for.
Charts can be considered to be in a bullish trend when there are higher highs and higher lows being made on the chart and breakouts above resistance. A chart defines the path of least resistance in a market and the odds of the next move in direction.
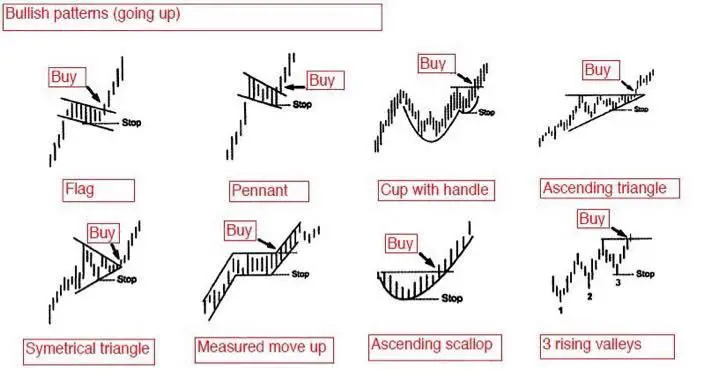
Here are the most common bullish chart patterns:
- Bullish Flag
- Bullish Pennant
- Cup with Handle
- Ascending Triangle
- Symmetrical Triangle
- Measure Move Up
- Ascending Scallop
- 3-Rising Valleys

Inside the lower time frames on a chart bullish candlestick patterns visually show buying pressure candle by candle. These bullish candle patterns can show the probability of a price reversal during a downtrend or the continuation of an uptrend already in motion. There can be single bullish candles or bullish candlestick patterns containing multiple candles in row.
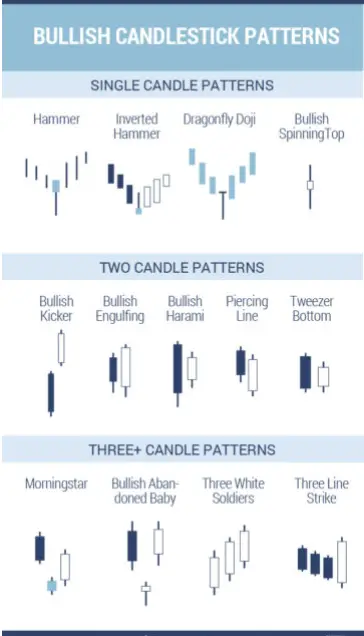
Here are some of the most popular and common bullish candlestick patterns seen on charts:
- Hammer
- Inverted Hammer
- Dragonfly Doji
- Bullish Spinning Top
- Bullish Kicker
- Bullish Engulfing
- Bullish Harami
- Piercing Line
- Tweezer Bottom
- Morning Star
- Bullish Abandoned Baby
- Three White Soldiers

Bullish candlestick patterns visually show the buyers were able to take price action higher and take control of a chart for the timeframe of the move. Most bullish candlestick patterns first form but then needs a follow up signal that confirms an upswing in price has begun.
The meaning and value of bullish candlesticks must be considered inside the full context of a chart and their confluence with other technical indicator signals. A bullish candlestick pattern that forms when a chart is already oversold could signal a reversal of a previous downtrend. Bullish candles that occur late in an uptrend after a previous long run up in price after a chart has become overbought will have a lower probability of a continued move higher.
Bullish candlestick patterns that have a confluence with other systematic buying signals like moving average crossovers, breakouts and other momentum signals increase the probabilities of a move higher.