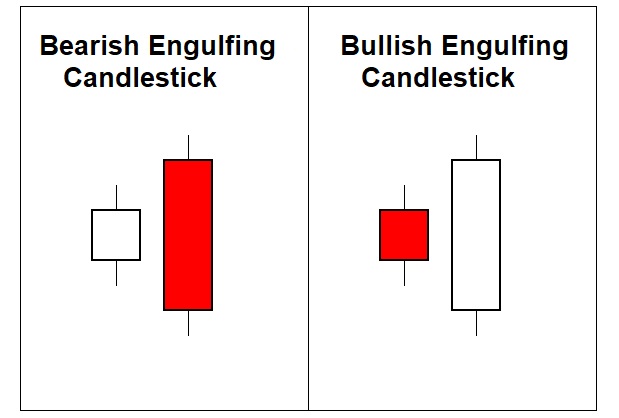
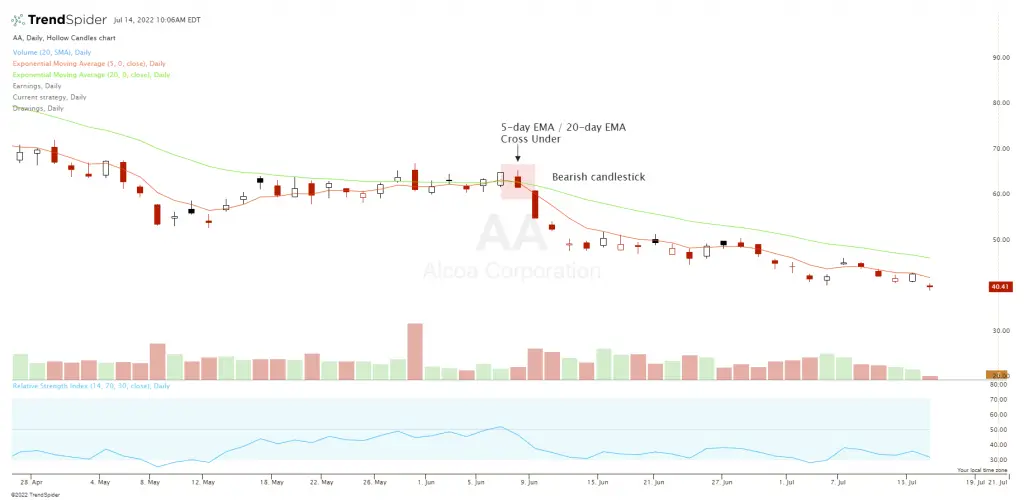
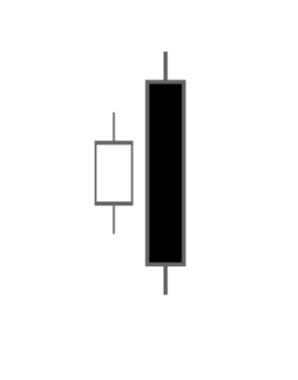
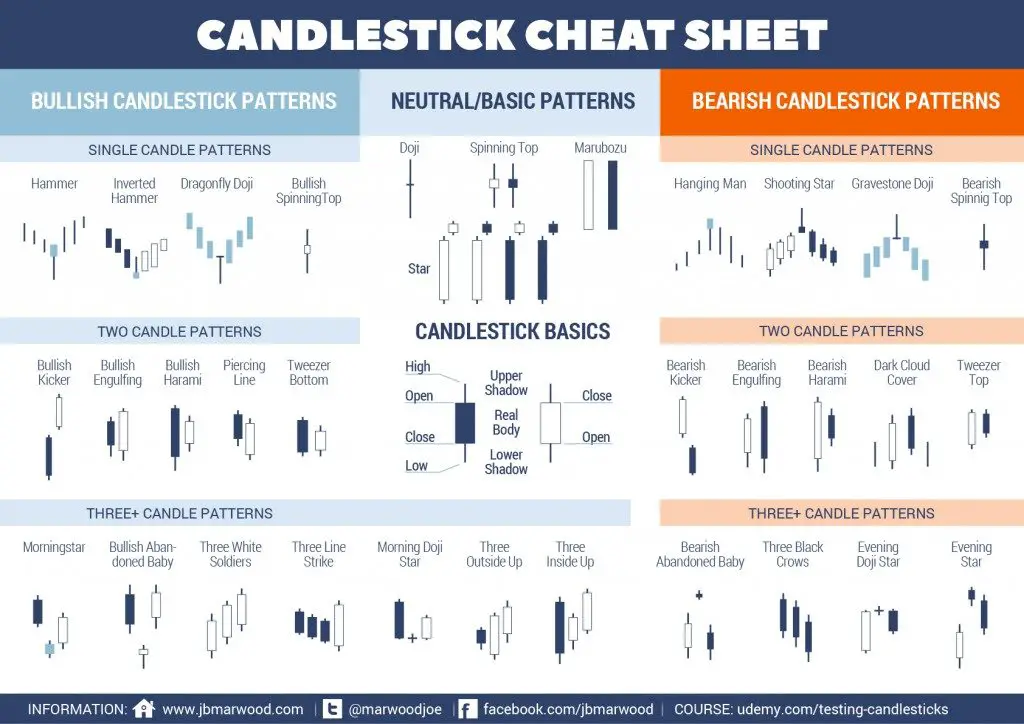
A bearish engulfing candle forms on a chart when a small body candle is inside the range of the next large down candle which can be black or red depending on chart settings. When a two candl... Read more
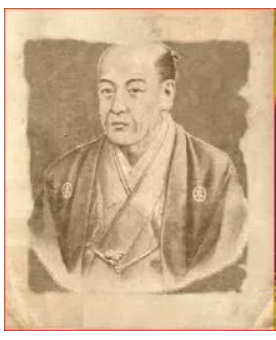
Munehisa Honma (本間 宗久) 1724-1803 is known as the father of the candlestick chart. He is believed to have been a rice merchant in 18th century Japan who traded the Dojima Rice market in Osaka... Read more
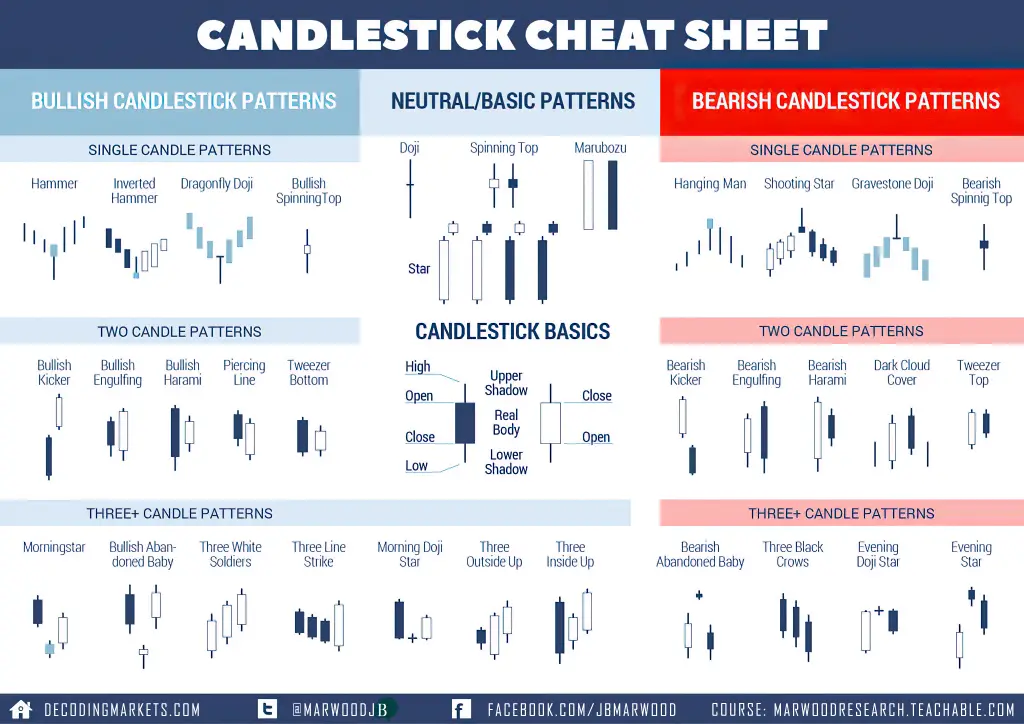
A candlestick chart is a type of visual representation of price action used in technical trading to show past and current price action in specified timeframes. Most candlestick charts will... Read more
The three white soldiers is a very bullish chart pattern that is created with candlesticks when there are three big candles formed in a row with higher highs and higher lows in a row. This p... Read more
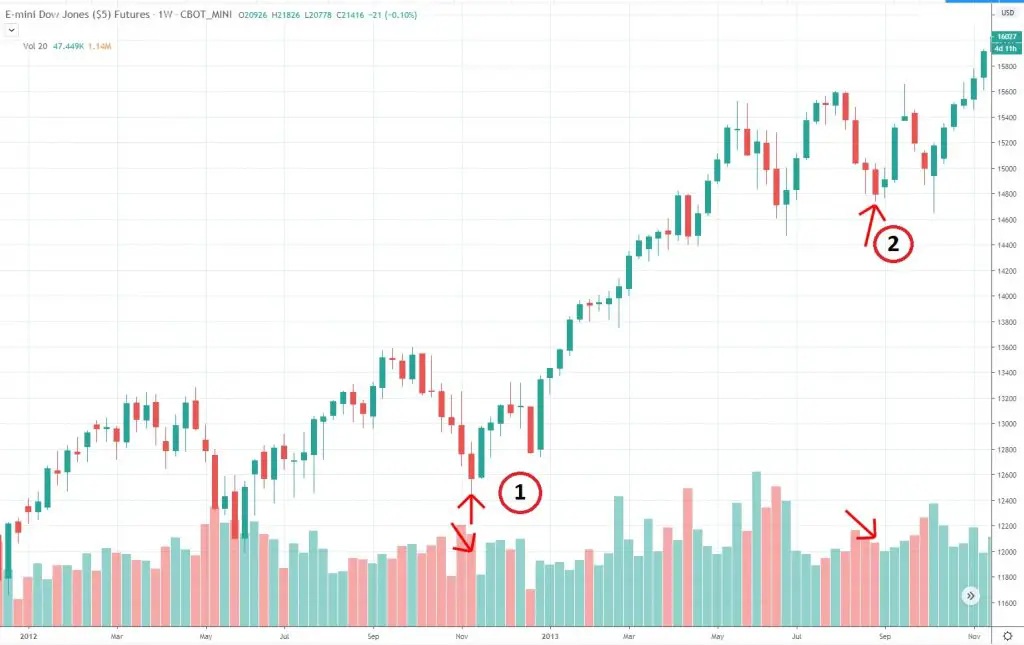
This is a Guest Post by Miad Kasravi @ZFXtrading of speculatorstrading.com. Trading with the Flow Part 1 of 3 Volume analysis Volume spread analysis or VSA. Looks at the relationship betwee... Read more
This is a Guest Post by @BullDudeC of BullDude.com. A Japanese candlestick chart is a type of visual price display of a financial instrument. Usually charts are displayed as a line t... Read more