March 2021

Heikin Ashi Candlestick Chart

Heikin Ashi Candlestick Chart

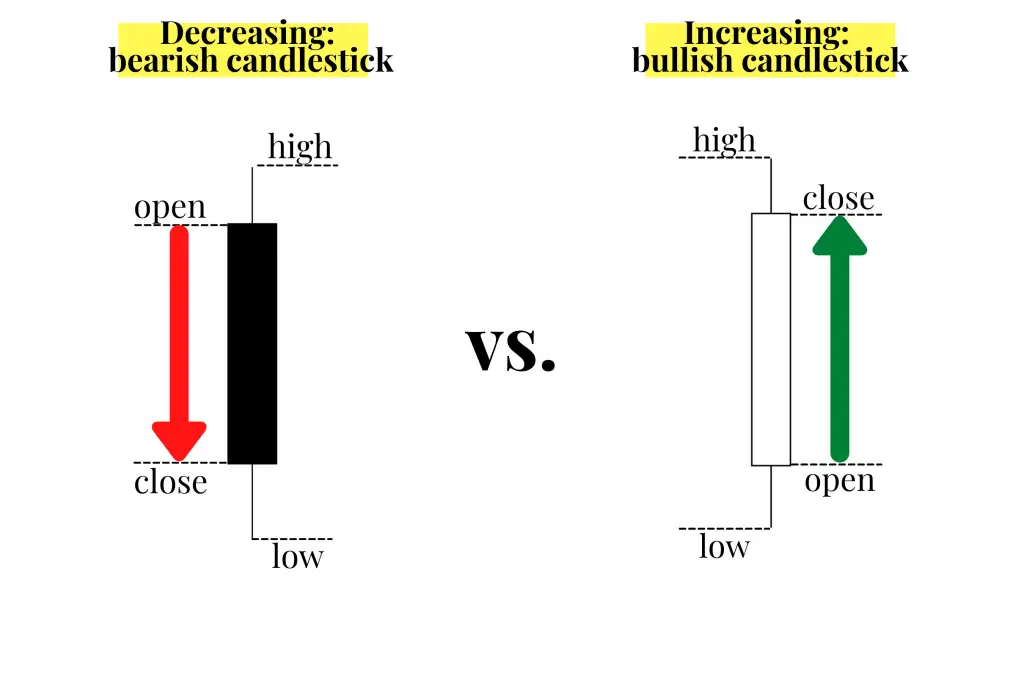
Heikin Ashi candlestick charts are a different variation of traditional Japanese candlesticks. Heikin Ashi candlesticks use the opening and closing price data from the previous period and also the opening-high-low-closing price data from the current period to build a combination candlestick. The Heikin Ashi formula candlestick filters out a lot of the price action noise …

Heikin Ashi Candlestick Chart Read More »

Best Moving Average Crossover For Swing Trading

Best Moving Average Crossover For Swing Trading

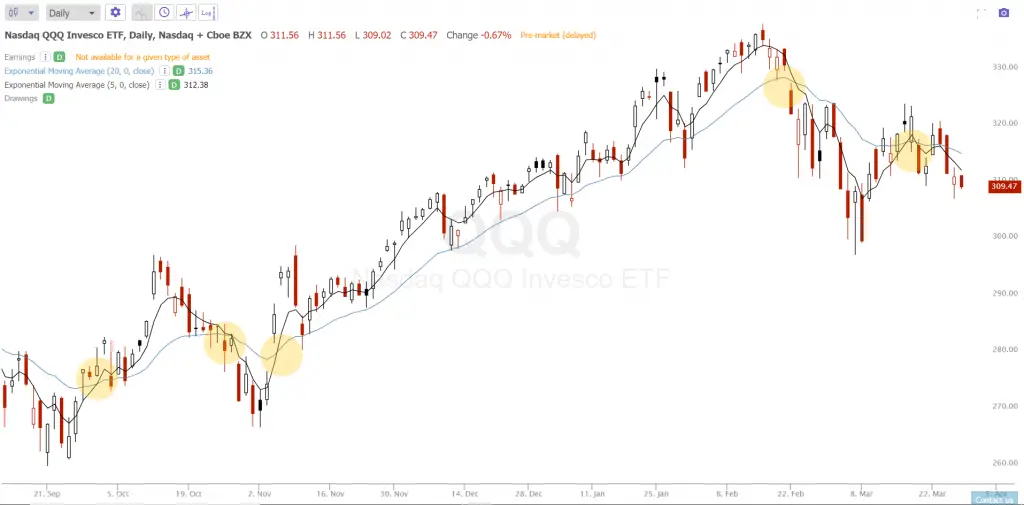
What is the best moving average crossover for swing trading? My favorite moving average crossover for swing trading that I have also confirmed through backtesting on the momentum names on my watchlist is the 5 day exponential moving average / 20 day exponential moving average crossover on the daily chart. I call this bullish crossover …

Best Moving Average Crossover For Swing Trading Read More »

Current NASDAQ Most Shorted Stocks 2021: March Update

Current Most Shorted Stocks NASDAQ 2021: March Update

Here is an updated top 20 list of the highest current most shorted stocks in the NASDAQ with the highest short interest in the middle of March 2021 based on the most recent information available. Be aware that the NASDAQ short interest is updated twice a month. Short interest data is reported on mid-month and end-of-month settlement …

Current Most Shorted Stocks NASDAQ 2021: March Update Read More »

Understanding Vega in Options

Understanding Vega in Options

Option contract prices will increase as the probabilities of them expiring in-the-money are greater and will go down as the probabilities of them expiring in-the-money decreases. As options get closer to being in-the-money they capture more of their underlying assets move, as they get farther away from being in-the-money they capture less of their underlying …

Understanding Vega in Options Read More »