Cracks in the Bull’s Horns: $SPY Chart: 8/12/18
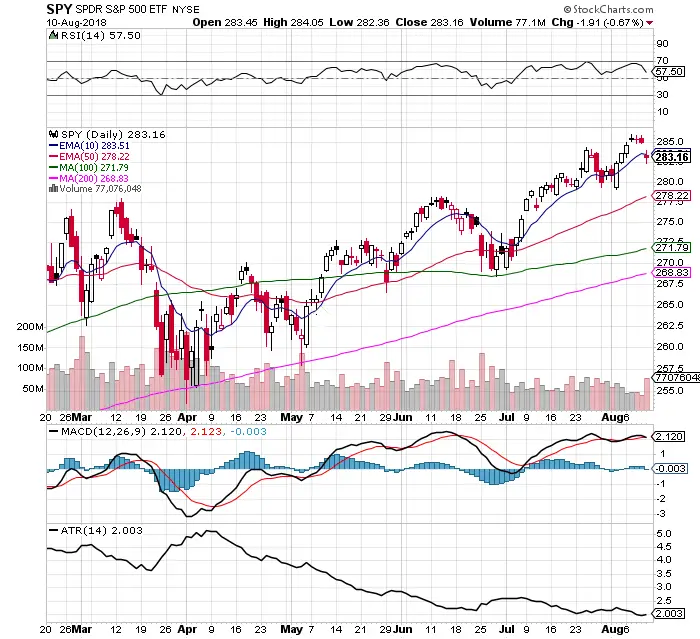
Chart Courtesy of StockCharts.com The new Turkey sanctions gave the stock market an excuse to sell off Friday. The high overbought 67+ RSI last week held as resistance. An RSI of 57.50 is a more neutral level as the chart resets. The $SPY unadjusted high of $286.63 held as resistance. $SPY price closed under the […]
Cracks in the Bull’s Horns: $SPY Chart: 8/12/18 Read More »