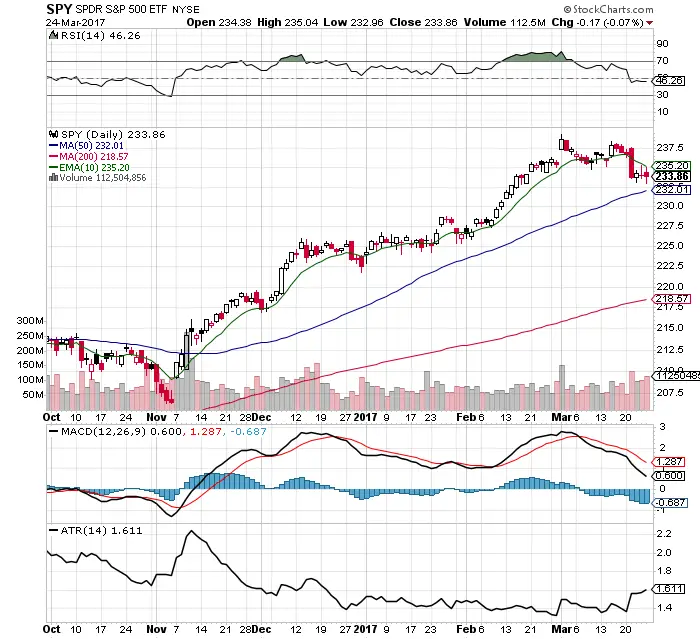
10 Facts About the $SPY Chart: 3/26/17
The long term uptrend is still in place. Short term resistance has become the 10 day EMA. Short term support is currently the 50 day SMA. A break out and close on the other side of one of these levels could signal the next trend up or down. RSI finally dropped below the neutral 50 to […]
10 Facts About the $SPY Chart: 3/26/17 Read More »