efficient markets hypothesis

What is the S&P 500?

The S&P 500 index is a system for quantifying and picking approximately 500 stocks that are updated regularly. The S&P 500 is weighted by market cap and stocks enter and leave their index based primarily on their size. Companies that do well and grow in market capitalization enter the S&P 500 and the companies that

What is the S&P 500? Read More »

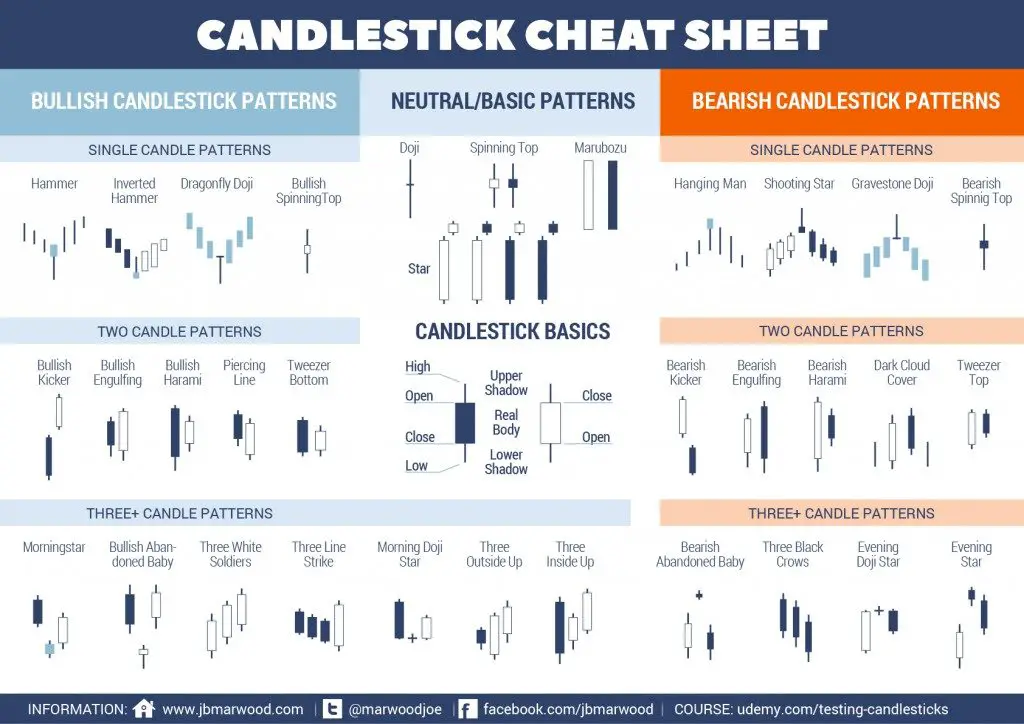
how to read candlestick charts

Types of Candlesticks and Their Meaning

A candlestick chart is a type of visual representation of price action used in technical trading to show past and current price action in specified timeframes.   Most candlestick charts will reflect a higher close than the open as represented by either a green or white candle with the opening price as the bottom of the

Types of Candlesticks and Their Meaning Read More »