50-day Moving Average Strategy
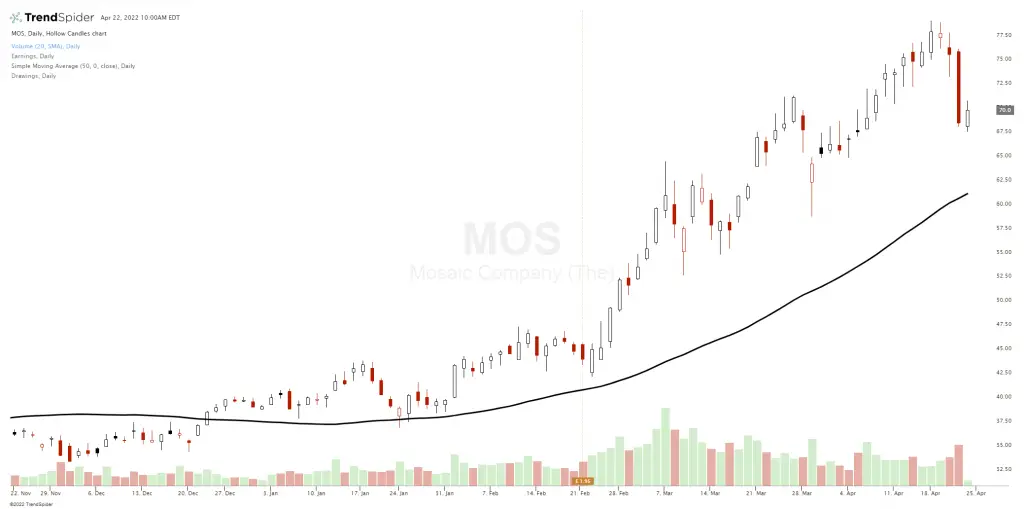
Chart courtesy of TrendSpider.comThe 50-day moving average strategy uses this line on a chart to filter whether a stock or index is in an uptrend or downtrend. Price above this line is bullish and prices below this line are bearish. Above this line traders should be thinking about long positions and below it they should […]
50-day Moving Average Strategy Read More »