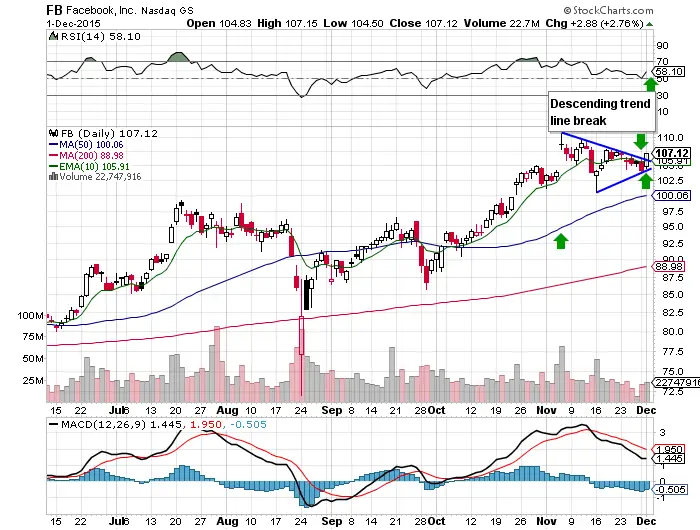
7 Bullish Facts about the $FB Chart
Bullish Facts about the $FB Chart All short term moving averages are over long term moving averages: 10 day over the 20 day and 50 day over the 200 day. Price broke above the 10 day EMA after being below it for four days. Price broke back above the 17 day descending trend line. […]
7 Bullish Facts about the $FB Chart Read More »